
Interactive Map for Partners In Health
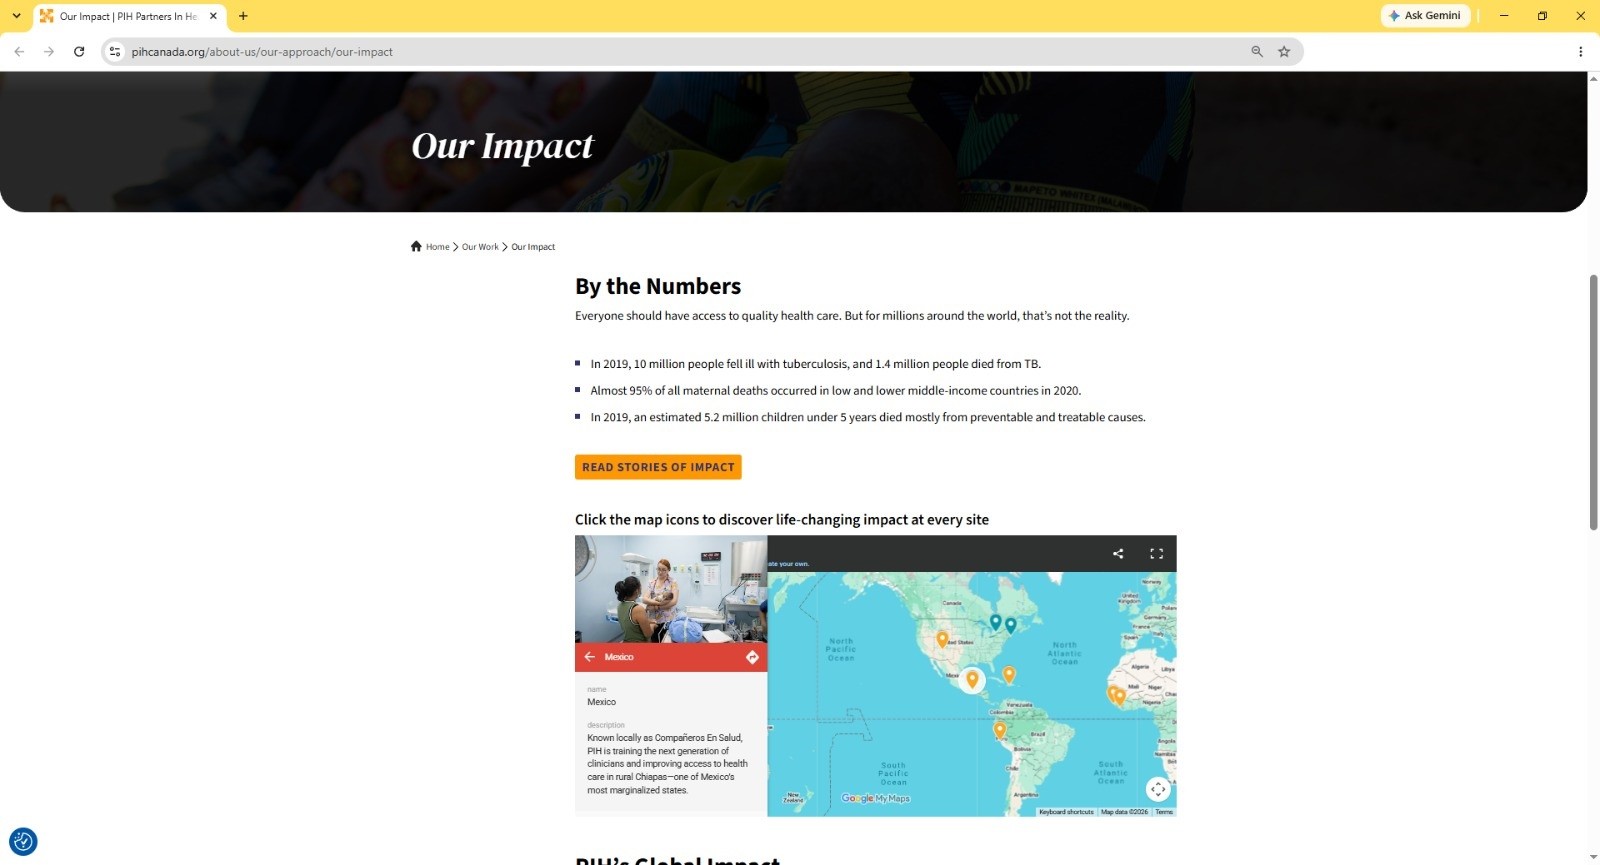
An interactive map showcasing PIH's work in 11 global locations, balancing storytelling with a user-friendly interface that was practical for the organization to implement. The best part? We inspired PIHC to feature one on their site!

Client:
Partners In Health Canada
Category:
NGO & Global Health
My Role:
Project Manager, UI/UX Researcher & Designer
Before Building: Meeting PIHC and Our Process
Our second-year Digital Experience Design cohort at George Brown College partnered with Partners in Health Canada (PIHC) to design digital solutions that make their global impact more visible, relatable, and engaging for donors. Despite PIH's extensive reach, their impact was not always immediately clear. Working within a $2,000-$5,000 budget and the need for easy-to-manage tools for a small team, we set out to create a user-friendly experience that could inspire more meaningful connections with their mission.
Process: 01 - Understanding the Challenge
Attended a kickoff session to learn about PIHC's mission, audiences, and challenges.
Collaborated with PIHC's communications team through feedback sessions and Slack.
Used campaign materials, brand guidelines, and real data to ground our design.
02 - Research & Insights
Conducted surveys and usability testing with participants aged 18–34 to identify pain points surrounding clarity, storytelling, and the donation experience. These insights directly informed our approach, reinforcing the need for transparent metrics and human-centered storytelling within the digital experience.
03 - Ideation
Developed 5 ideas for PIHC, exploring different ways to address the insights uncovered during research. These concepts were presented to PIHC directly and feedback was received on the strongest directions.
04 - Final Pitch to PIHC
Final Work: Solution & Prototypes
With budget and scaling in mind, we developed two prototypes for the impact map and one for the categorized donations:
Easy-to-implement map that can be embeded directly on PIH's site.
Linked to Google Sheets for seamless updates to site content.
Free with Google Workspace, but limited in interface and user experience.
Visually enhanced map created on Figma that gave our team full design control. Implementable with either ArcGIS or Mapbox, but with a cost.
Branded user interface with an enriched user experience, allowing for future CRM integration.
Designed for meaningful engagement, connecting users to PIH’s impact through stories, data, and achievement highlights.
Built as an addition on donor page using Figma to help categorize broad impact categories.
Has a selection tool to learn more about PIH’s impact in categories areas such as healthcare, buildings, social support, and education.
Transparency statement shown before donor confirms personal information.
Features in both impact map prototypes include:
Key metrics to illustrate tangible impact.
Authentic stories from patients, healthcare workers, and communities.
Calls to action that encouraged users to learn more or donate.
These features were chosen specifically to humanize the organization's impact and foster a connection with the audience, helping them feel more confident in their contributions.

Results: Our Impact on PIHC
Throughout this project, our team honed our skills in empathy-driven design, storytelling, and resource-conscious implementation. The most rewarding outcome was seeing our prototype directly inspire PIHC to add a global impact map on their site!
Creative Contributors
This project was a fully collaborative effort, I worked alongside Annia, Emma, and Chloe.
For efficiency, we split into two parallel workflows: Chloe and I focused primarily on the stylized Figma impact map, while Annia and Emma concentrated on the Google My Maps implementation.
Even with this division of tasks, every major decision was made collaboratively. We shared progress frequently, exchanged feedback, and ensured that both prototypes aligned with PIH’s mission and our collective vision.